Using QlikView’s Associative Property for Complex Data

QlikView is famous for its association property. It associates every table based on their standard fields automatically. This property is beneficial if the data is straightforward, but what if the data is complex? Here is my experience with QlikView’s association property while working on complex data.
Recently, I was working on one of the QlikView dashboards. I was required to create a dynamic chart based on my selected dimensions and measures.
The base tables I had were as Follows
- There were 3 columns in this table. List of tables and their respective columns, along with an indicator of whether the column is a dimension or a measure.
- The data for each Person’s table.
- The data for each Product table.
- The data for each of the Sale’s tables.
QlikView charts require columns to be split into dimensions and measures. This increases complexity further. I split the dimensions and measures into two different list boxes to create a dynamic chart. But whenever I used to select a particular dimension, I could not select a related measure. The associative property, the USP of Qlikview was not helping me at all!
How did associativity work in this case?
After a little digging, I understood the whole scenario! Table 1 had 3 columns – Table Names, Column Names, and Column Type. Column Names had dimensions and measures in the same column. Because of the associative property on selecting dimension measures used to get disabled and vice versa. As a result, I could not use the associative property of QikView fully!
The Way Around
My requirement was a simple one, but due to QlikView’s associative property, it turned out to be a complex one. After trying a few solutions in the list box expressions, I had to spend much time solving this problem. Eventually, I found that the answer is to change the load script.
The Table Name and Dimensions were extracted in the first Script. Then the table Name and Expressions were removed. Since Table Name was common, the associative property helped me finally! So, instead of one load script, I had to use 2 separate scripts.
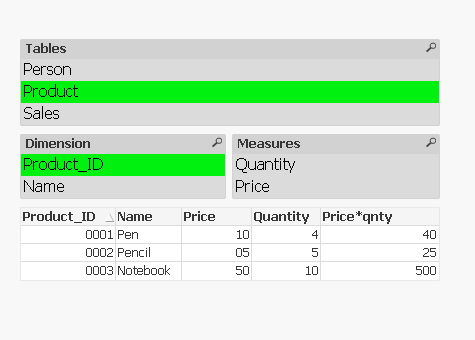
Now, the dashboard looked like this:

While working on this problem, I had another thought. Had the tool been PowerBI, it would have been a straightforward implementation for me. I would have completed this in half of the time that I spent on QlikView.
I tried to replicate this scenario in Power BI to test it out. In power BI, I only had to click on the stop interaction tab to stop the association between these 2 list boxes. It took just a few clicks and less time to achieve this.
For this scenario, I think Power BI is a better tool. But I will keep QlikView, as it has its strength in specific cases. Though associative property didn’t work in my case, the way of implementation matters most of the time. If we need to associate 2 or more tables, we don’t have to worry about how we will associate them. QlikView application can easily handle all of it.
This was one of the flaws I experienced while working on QlikView.